FEATURES

Answers, alerts, and foresight — built in

Every Pulsemetry capability exists to answer one of three questions: what changed, why it changed, and what happens next.

Core capabilities

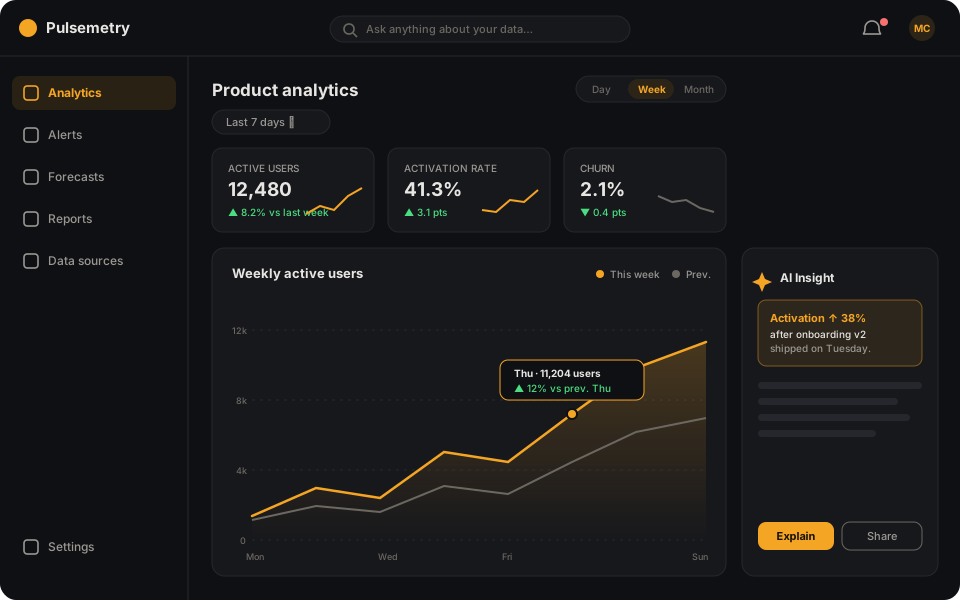
Analytics screen with metric cards, weekly active users chart, and AI insight panel (fictional demo)

Ask anything

Plain-language answers with evidence

Type a question the way you'd ask a colleague. Pulsemetry translates it into the right query, charts the answer, and explains the likely cause — deploys, campaigns, seasonality, or segment shifts.

See supported data sources
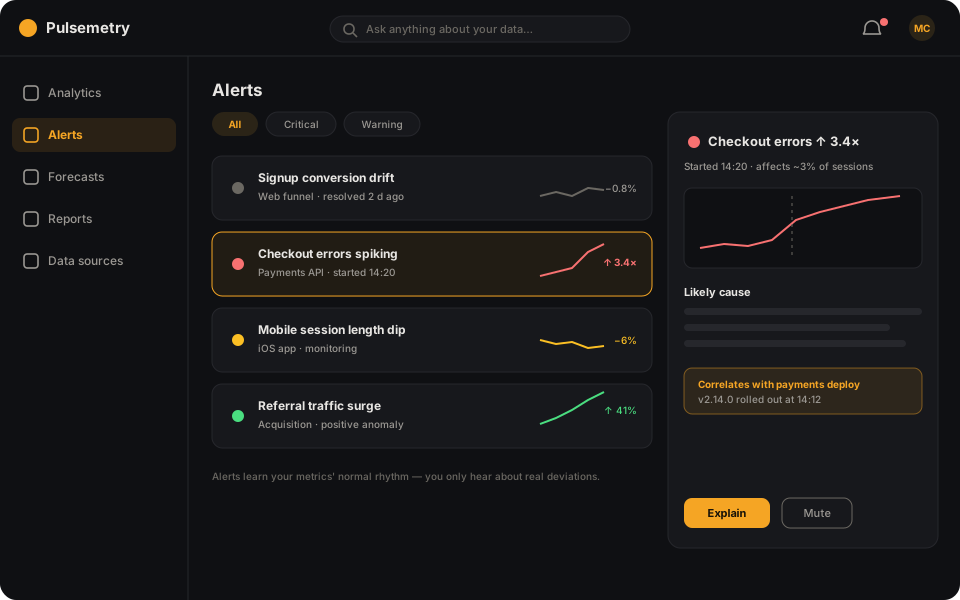
Alerts screen with anomaly list and a detail panel explaining a checkout error spike (fictional demo)

Stay ahead

Alerts that learn what normal looks like

No brittle thresholds. Pulsemetry models each metric's rhythm — weekday cycles, seasonality, launch spikes — and pings you only on real deviations, positive ones included.

Alerts are included in every plan
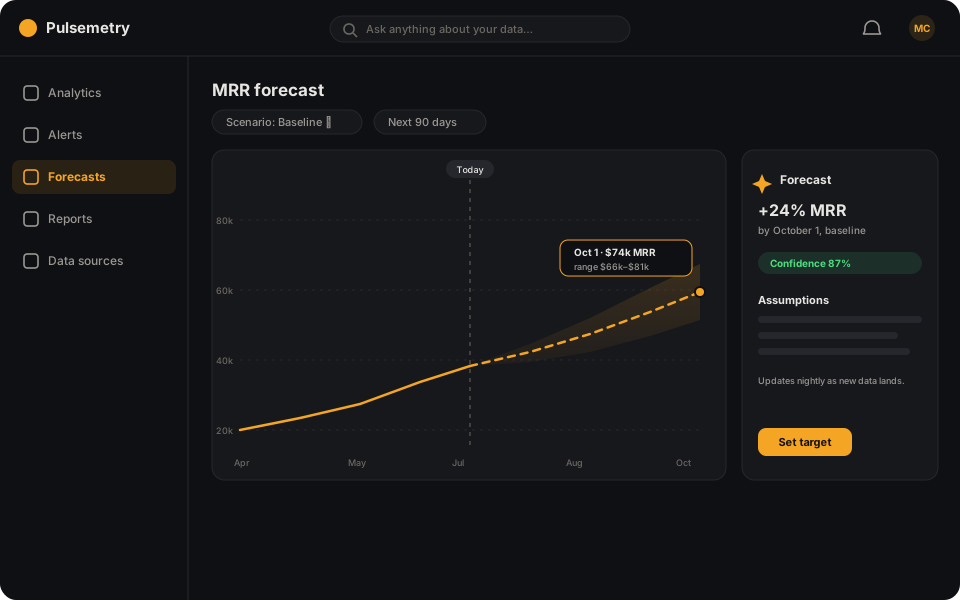
Forecast screen with MRR history, dashed projection and confidence band (fictional demo)

Plan with confidence

Forecasts that update themselves

Nightly recalculated projections with a visible confidence band and disclosed assumptions. Set a target, share the link, and watch the gap close — no spreadsheet gymnastics.

Built for the whole team

Same data, three very different mornings.

  • Product teams

    Track activation and retention without writing SQL. Ask why a metric moved and get an evidence-backed answer before standup.

  • Growth teams

    Correlate spikes with campaigns automatically. Catch a winning channel while it's winning — and a broken funnel before the weekly report.

  • Data teams

    Stop being a ticket queue. Every AI answer exposes its generated query, so analysts keep full control and auditability.

See it on your own data

14-day free trial. Read-only connections. First insight in about 12 minutes.