Ask in plain language
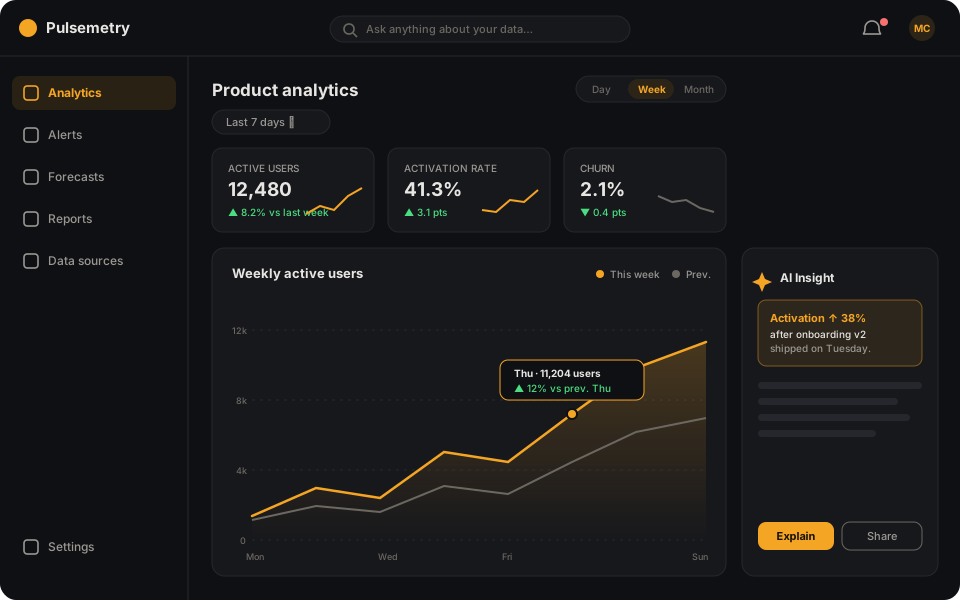
"Why did activation drop last week?" — ask like you'd ask a colleague and get an answer with numbers, charts, and the reasoning behind them. Analysts can open the generated query behind every answer.
v2.0 — AI copilot now in early access
Pulsemetry watches your product data, spots what changed, and explains why — in plain language, right where your team works.
01 · FEATURES
Dashboards show what happened. Pulsemetry tells you why — and what to do next.
"Why did activation drop last week?" — ask like you'd ask a colleague and get an answer with numbers, charts, and the reasoning behind them. Analysts can open the generated query behind every answer.
Learned baselines instead of noisy thresholds: get pinged only when a metric truly misbehaves — in Slack, email, or your on-call tool.
Turn any answer into a living dashboard the whole team can follow — no query builder required.
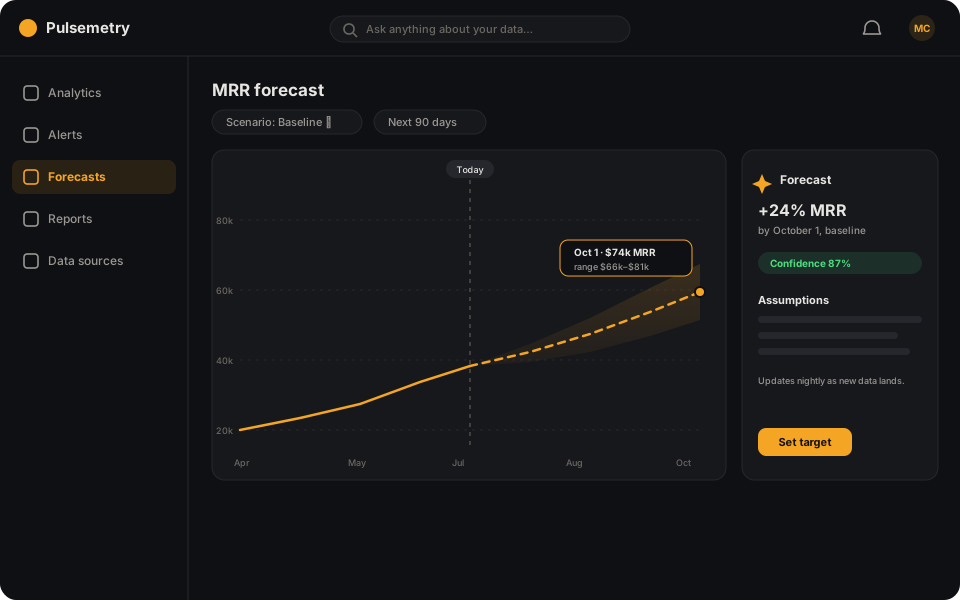
Projections update nightly as data lands, so plans rest on today's trend — not last quarter's.
40+
Warehouse, product analytics, billing, CRM, and support tools connect in minutes with read-only credentials.
02 · PRODUCT TOUR
Three moments where Pulsemetry replaces hours of digging with one look.
Stay ahead
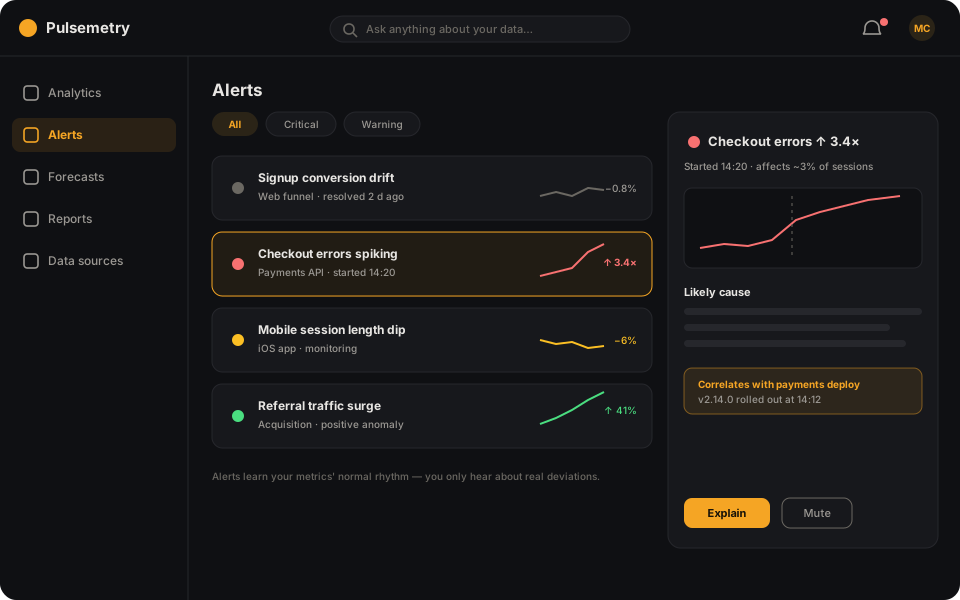
Pulsemetry learns each metric's normal rhythm and alerts you on real deviations — not on every wiggle.
Ask anything
No SQL, no query builder, no waiting for the data team. Every answer comes with evidence and the likely cause.
Plan with confidence
History, trend, and a confidence band — recalculated nightly. Set a target and watch the gap close.
03 · WHY SWITCH
What changes when your analytics can explain itself.
| Dashboards + SQL | Pulsemetry | |
|---|---|---|
| Time to answer “why” | Days of digging | Minutes, with evidence |
| Anomaly detection | Manual thresholds, noisy | Learned baselines |
| Setup | Weeks of modeling | 12 minutes, read-only |
| Weekly reporting | Screenshot collages | Auto-written summaries |
| Who can use it | Analysts only | The whole team |
04 · PROOF
What product people say after their first week.
“Pulsemetry told us why activation dropped before our Monday standup. We shipped the fix the same day.”
“We replaced three dashboards and a weekly analytics meeting with one question box. Honestly didn't expect that.”
“Setup took eleven minutes. The first anomaly alert paid for the whole year of the subscription.”
05 · PRICING
Start free, upgrade when the insights pay for themselves.
$19 / month
$49 / month
$99 / month
All plans include a 14-day free trial. No credit card required.
Encrypted in transit & at rest
SSO & role-based access
Read-only connections
Delete your data anytime
06 · FAQ
Everything teams ask before the trial. Something else? Write to us.
Every plan starts with 14 days of full access — no credit card required. Connect a data source, invite your team, and decide at the end whether it earned a place in your stack.
No. Ask questions in plain language and Pulsemetry handles the querying. Analysts who want the details can open the generated query behind every answer.
40+ sources: data warehouses, product analytics, billing, CRM, and support tools. Most connections take a few minutes with read-only credentials.
Data is encrypted in transit and at rest, access is role-based, and read-only connections are the default. You can delete your workspace and its data at any time.
Yes — cancel in two clicks from the billing page. Yearly plans are refunded pro-rata for unused full months.
Early-stage startups and registered nonprofits get 50% off the Pro plan for the first year. Mention it when you sign up.
Join the early-access list and get your first insight within 12 minutes of connecting a data source.